Observability
made easy
Observability shouldn't be complex or expensive. Trace0 combines traces, logs, metrics, and alerts into a simple platform for teams and agents.
No credit card required · 14-day trial · All features included

Observability shouldn't be complex or expensive. Trace0 combines traces, logs, metrics, and alerts into a simple platform for teams and agents.
No credit card required · 14-day trial · All features included
Monitor, debug, and understand your applications. All in one place.
Understand every request from end to end. Trace0 automatically captures spans and logs, arranging them into a clear call tree.
See where time is spent in every request, helping you identify bottlenecks and performance issues.

Search transactions by simple free text search, service, time period, and more. No new query language to learn.

Search and explore logs across all your services from a single place.

Monitor latency, error rates, resource usage, and more in clear, easy-to-read dashboards.

Receive real-time alerts to email and Slack for service errors and metrics thresholds.

Trace0 is built on OpenTelemetry, so you can instrument your services using standard, open-source libraries. Works with all OpenTelemetry-supported languages and compute platforms across AWS, GCP, and Azure.
Install Trace0 in a few minutes. Just add the OpenTelemetry tracing agent as a dependency to your project and that's it. See our setup guides →
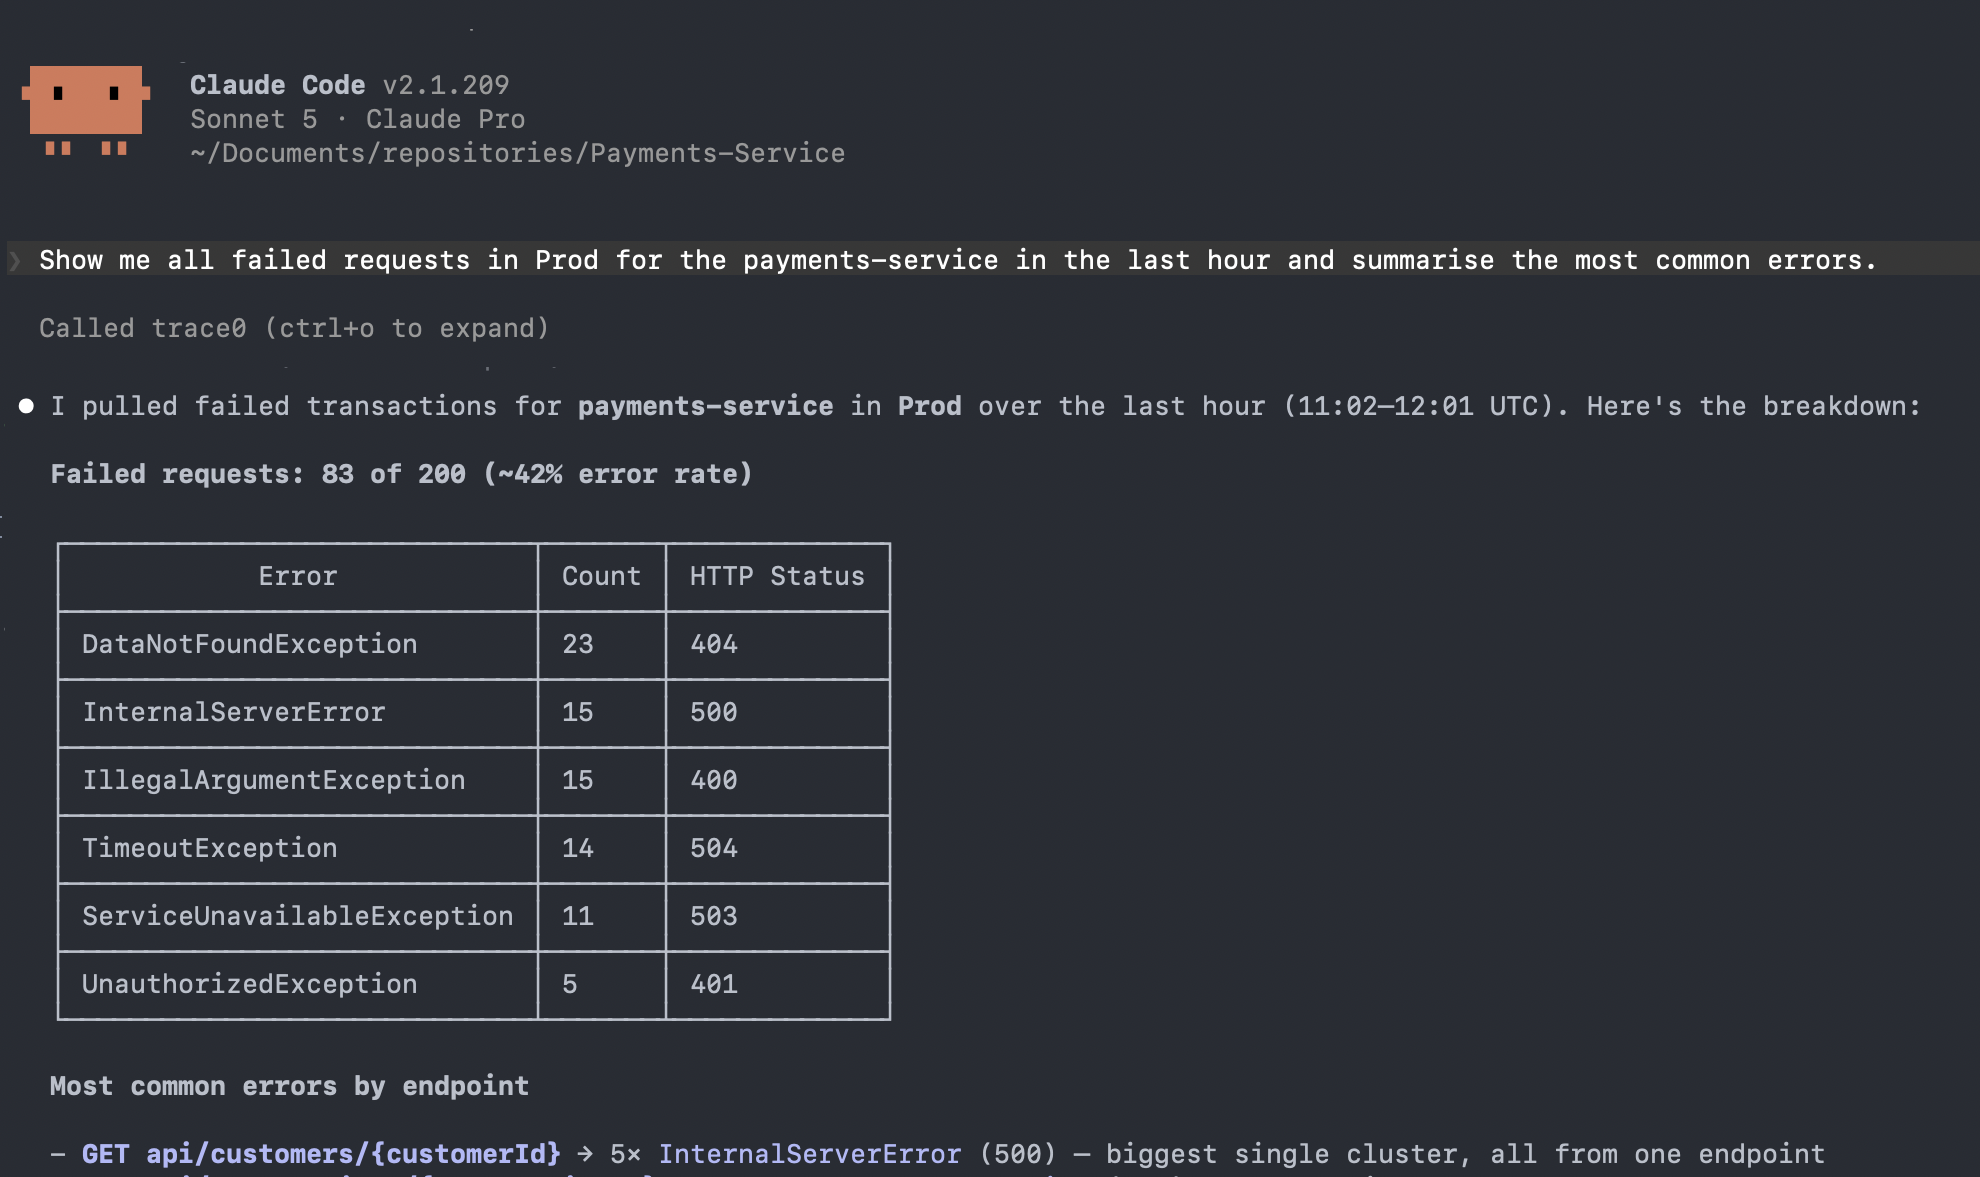
Connect Claude Code, Cursor, and other MCP-compatible AI agents to Trace0. Investigate errors, analyze performance, and troubleshoot issues faster.
Pay only for what you use. All features included. No hidden fees.
Simple, usage-based pricing — nothing else.
OpenTelemetry provides instrumentation libraries for many popular languages and frameworks, including Java, Kotlin, JavaScript, TypeScript, Python, Go, .NET, PHP, Ruby, Rust, and more.
See the OpenTelemetry language documentation for the full list of supported languages, and our language-specific setup guides for instructions on installing Trace0.
Usage is measured at the point data arrives at the Trace0 ingest endpoint. This ensures all telemetry sent to Trace0 is accounted for consistently, regardless of the source or transport mechanism.
Usage is calculated using the uncompressed size of the telemetry payload after it has been decoded from Protobuf. This reflects the actual volume of telemetry data being processed and stored, rather than any transport-layer compression that may have been applied during transmission.
Start your 14-day free trial and see how Trace0 simplifies your application observability.